Four accounts, three platforms, five years. What I saw, what I changed, what it returned, and how the return was measured. The measurement note is not a disclaimer. It is the part most people leave out.
Before the numbers
Two things get called revenue. Only one is counted.
Counted metrics are recorded by the platform. It charged the money and logged the action. Cost per conversion, cost per click, spend. Nobody can inflate these.
Assigned value is a figure the advertiser attaches to each conversion event before the campaign runs. It is what ROAS is calculated from. On LinkedIn it includes post-view conversions on a 30 day window, so several campaigns can be credited for the same purchase.
I show both, and I label which is which. If someone quotes you a ROAS and cannot tell you how conversion value was defined and what the attribution window was, that is the question to ask.
July 2024, ed-tech account. One month, measured both ways.
Counted Assigned, 30 day post-view
Ed-tech platform · LinkedIn · full account
1–31 July 2024
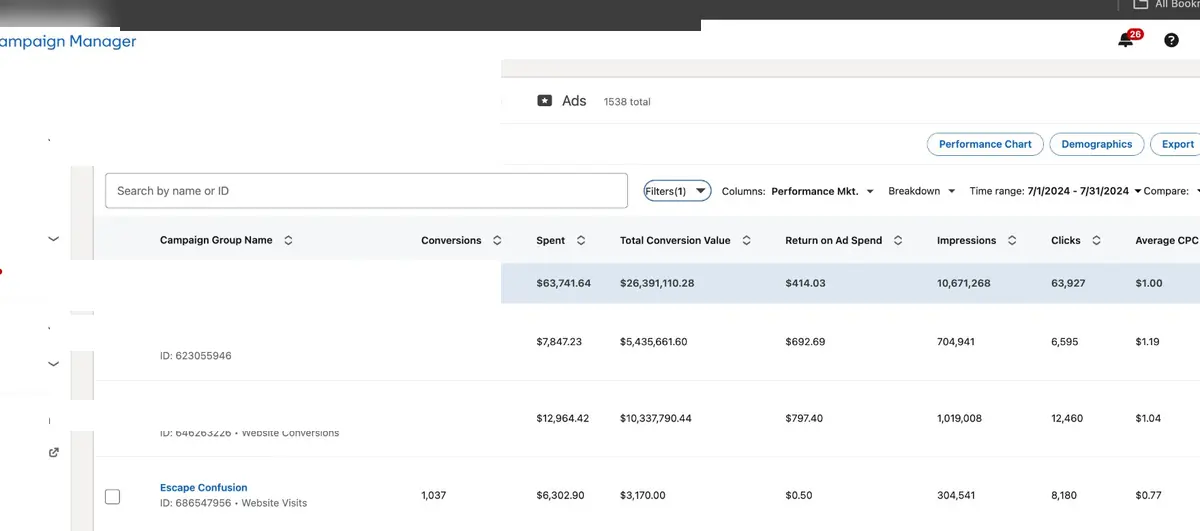
One month of a fully segmented account. 51 campaign groups, 230+ campaigns, 1,538 ads live at once. Every audience had its own creative, bid strategy and funnel entry point.
What I saw
An account that could deploy budget, but nobody could say which part of it was producing revenue. Conversions were being counted without values attached, so on the dashboard every campaign looked roughly as good as every other campaign.
What I realised
Broad campaigns give you an average, and an average cannot tell you what to scale. The account was never built to answer a question, so no amount of optimisation inside it was going to produce an answer.
What I changed
Insight Tag rebuilt with conversion values attached before any further spend. Every campaign mapped to a funnel stage instead of a platform objective. Creative tested at the hypothesis level, three running in parallel at all times.
What happened
Cost per conversion fell from $2.23 to $0.57 while spend went up, across 51 campaign groups and 230+ campaigns each built to answer something specific.
A working feedback loop between creative, audience and conversion data.
$0.55cost per conversion, counted, at 14,170 conversions
LinkedIn Campaign Manager, unedited apart from client name and campaign IDs. Time range visible top right.
Ed-tech platform · bottom-funnel retargeting
1–31 July 2024
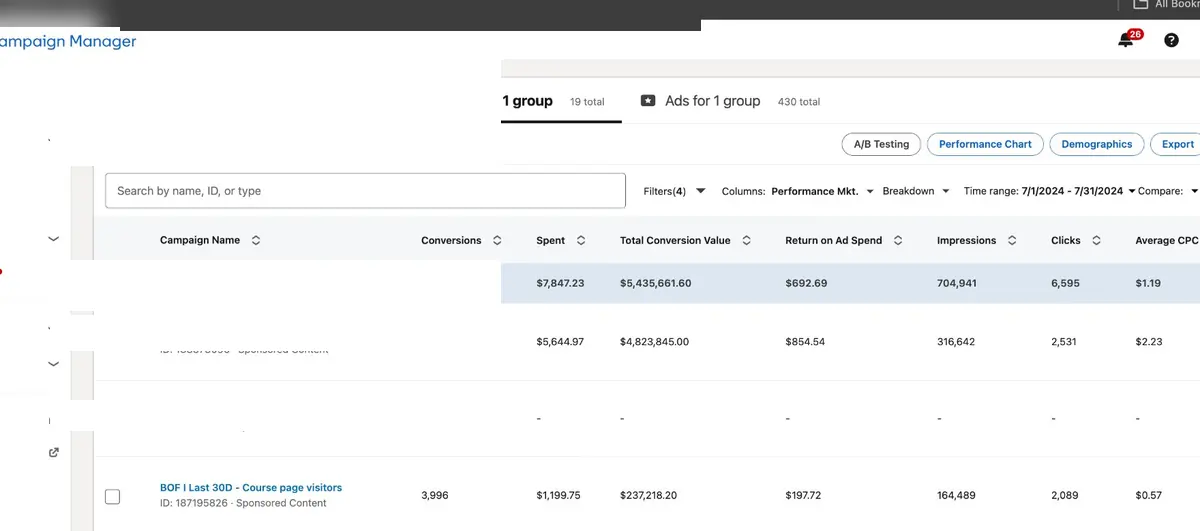
Course page visitors, last 30 days, sponsored content. This is the number I am proudest of, and the one nobody asks about.
Warm demand and cold brand are two different jobs. Splitting them off their shared budget is the reason this number exists.
$0.30per conversion, at real volume
Against the wider account, same month. Lower is better. Both counted. Show the account screenshot
Bottom row is the campaign described above.
Brand campaign · LinkedIn
8 Jan – 6 Aug 2024
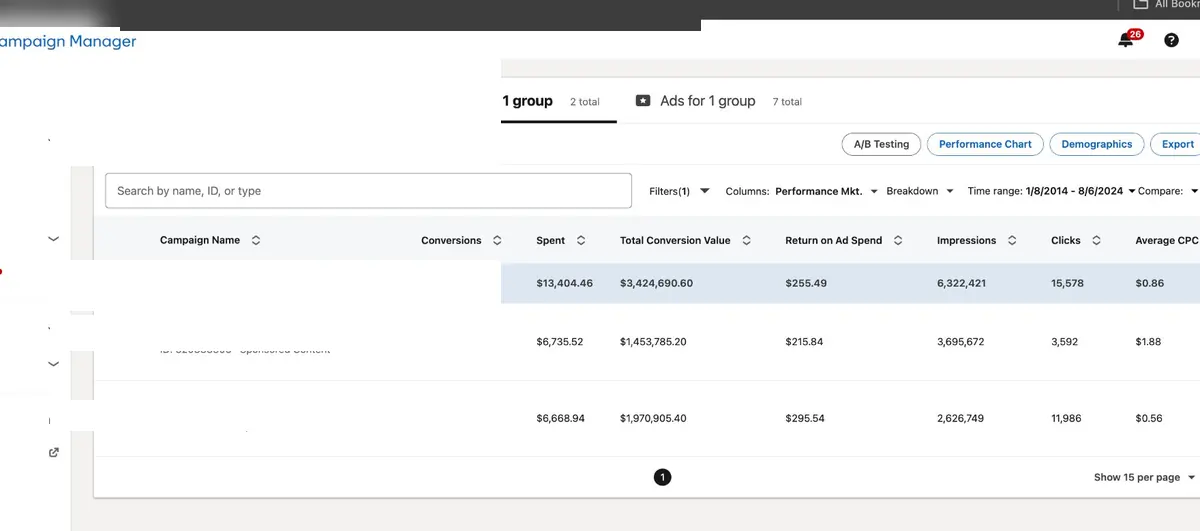
Holding an $0.86 cost per click across 6.3 million impressions, over seven months, on a platform where a $6 CPC is normal.
Retargeting is measured on cost per conversion. Brand is measured on cost of attention over time. Averaged together they produce a number that flatters both and describes neither.
$0.86
Average CPC, counted
6.32M
Impressions
15,578
Clicks
$13,404
Total spend
Platform reported $3,424,691 in conversion value against that spend, a 255× ROAS. Same assigned-value caveat as above.
Show the account screenshot
Subscription app · Meta and lifecycle
Q4 2021
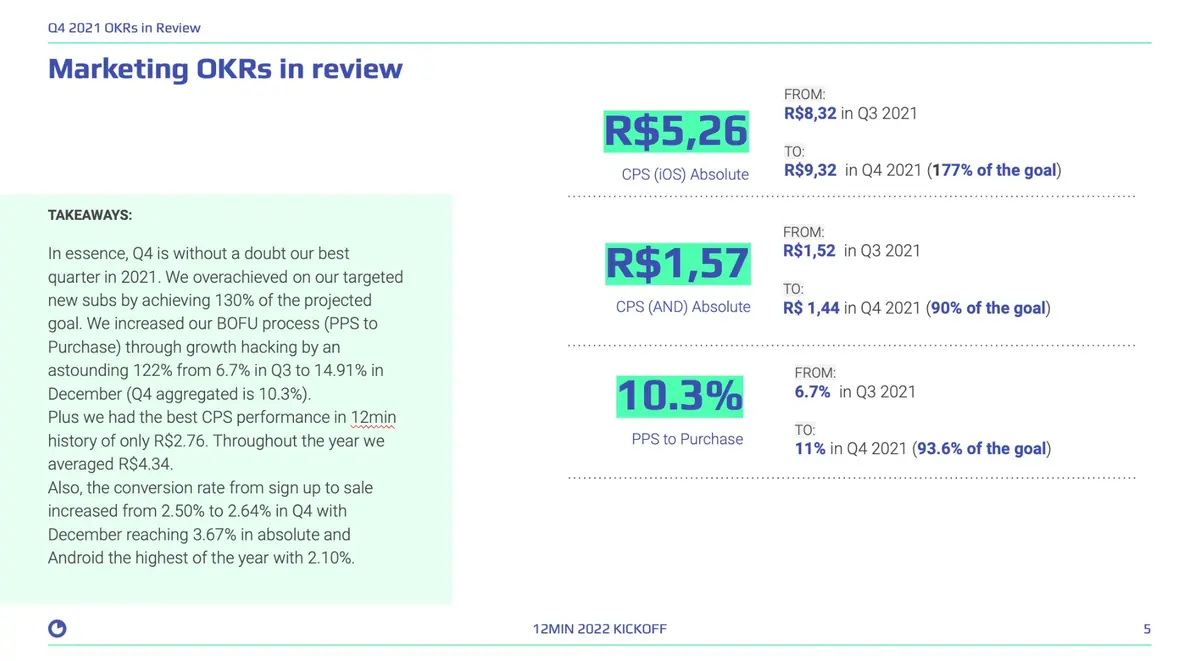
The strongest evidence here, and it is not my screenshot. It is the client’s own quarterly review, written by their team, measuring the work against goals they set before it started.
What I saw
Three markets, rising acquisition costs, and an attribution picture that could not say which campaigns were producing paying subscribers rather than installs.
What I realised
The pressure everyone felt was at the top of the funnel. Page-per-session to purchase was converting at 6.7%, and fixing that is worth more than any bid adjustment. It is also cheaper.
What I changed
Rebuilt the bottom-funnel conversion path through systematic experimentation. Restructured audience architecture across Meta down to 86 active ad sets. Introduced attribution frameworks that distinguished a subscription from an install.
What happened
Page-per-session to purchase from 6.7% to 10.3%, and 130% of the Q4 subscriber target. The best quarter in the company's history.
A funnel that stopped losing the people the ads had already paid for.
Cost per subscription, iOS. The target allowed it to rise. It fell instead.
177% of goal
Bottom-funnel conversion, page-per-session to purchase.
+122% on baseline
130%
of the new subscriber goal
R$2.76
Best month CPS, best in company history
3.67%
Signup to sale in December, from 2.50%
R$4.34
Full year average CPS
Show the client’s quarterly review
The client’s own Q4 2021 OKR review, from their 2022 kickoff deck.
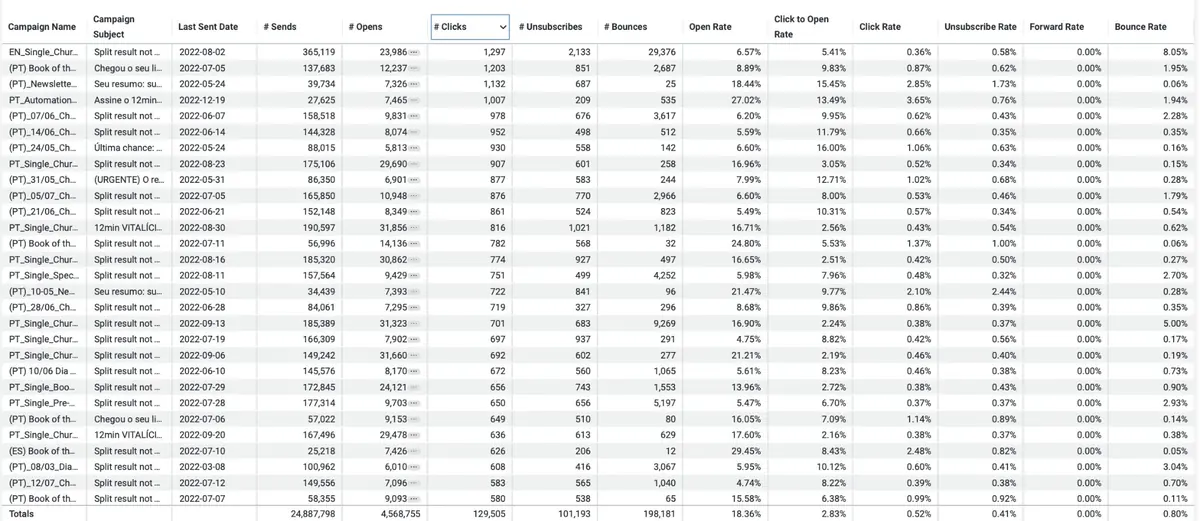
Lifecycle email at scale · Portuguese, English, Spanish
2021–2022
Twenty five million sends across three languages. At this volume the achievement is list health, not open rate. Anyone can post a good open rate on a small clean list.
Volume is easy. Deliverability at volume is the part that breaks.
24,887,798 sends. Everything below is drawn to true scale. Show the campaign export
Totals row at the bottom. Campaigns in Portuguese, English and Spanish.
Fitonomy · Meta ads and product strategy
E-commerce and app
The one case on this page with no screenshot. The account is not mine to export from any more, so these figures are mine to state and yours to test on a call. I would rather say that than quietly leave the case out.
What I saw
Paid social performing on its own terms, while the product it was pointing at decided whether any of that performance survived past week one.
What I realised
Optimising install cost without touching retention buys you an expensive audience that leaves. The work had to cross into roadmap decisions or the acquisition number meant nothing.
What I changed
Ran the Facebook and Instagram campaigns for the supplement store, built the seasonal sale system, audience segmentation and creative testing framework. Then took the same data into product roadmap sessions, onboarding funnel analysis and feature prioritisation with the founding team.
What happened
12× average ROAS on sale campaigns, $0.23 cost per install, 847K total installs, and a 54% loyal user rate on the other side of them.
Install cost is a marketing number. Retention is the one that made it worth having.
12×
Average sale campaign ROAS assigned
$0.23
Cost per install, counted
847K
Total app installs
54%
Loyal user rate
Fitonomy · Meta ads and product strategy. Stated from my own records, not from a platform export. ROAS is advertiser-assigned; install and cost figures are platform-counted.
Ask me the hard question.
If you are spending on paid media, there is a number in a dashboard somewhere you are not completely sure about. Bring it. I would rather spend the first call taking your reporting apart than talking about mine, and I will walk you through whichever account above is closest to your situation, including the parts that did not work.